I have a new paper, “Classification and mapping of low-statured shrubland cover types in post-agricultural landscapes of the US Northeast”, out today in the International Journal of Remote Sensing! This project was a fantastic collaboration with with Lucas Johnson, Abigail Guinan, and Colin Beier, and I’m thrilled to see it in print.
Shrublands – which we roughly define as “vegetation that’s too tall to be a grassland, but too short to be a forest” – are a pretty rare land cover class in the northeastern United States. In part, that’s because our forests out here are generally pretty stable, and don’t get completely wiped out in the same way as forests in the western US, which means there’s just not a ton of land reforesting after some major disturbance. But also, most forests in the Northeast got their start by taking over abandoned farmland, which was generally left unplowed following major bank runs in the late 1800s and early 1900s.1 Because the first trees to establish on a field all grow up at more or less the same rate,2 that means that older forests are taller forests. With most of our forests pushing 100,3 we don’t have a ton of low-statured vegetation to go around in the region.
And this is a problem! A ton of wildlife species really prefer shrublands, and depend on denser understories and lower branches than 100 year-old forests really provide; a turkey isn’t going to be able to hide from predators in a stately grove of 80 foot tall pines. New York is intentionally managing its public lands to try and increase the prevalence of shrublands for this reason. Shrublands also are promising targets for conservation efforts designed to increase carbon sequestration in the landscape, as they represent potentially unproductive (from a carbon sequestation standpoint) lands returning to forest. While there’s a lot of ink spilled about the sequestration potentials of young forests versus older forests, everyone is generally agreed that we want more protected forestlands to improve carbon sequestration, and being able to identify and preserve current shrublands would likely mean increasing the amount of forestlands in the future.
And as such, there’s a lot of interest in being able to map shrubland prevalence in the Northeast. Unfortunately, that’s easier said than done. Because shrublands are so rare in this region, they’re generally not well-represented in most land cover mapping projects; shrublands make up about 2% of the landscape, and so a model can be wrong about shrublands 100% of the time and still be 98% accurate if it nails everything else. Shrublands also look different in the Northeast than they do elsewhere in the country; whereas much of the western United States has semi-permanent shrubland biomes with different species and structure than forestlands, in the Northeast shrublands are generally composed of the same species as forests, just shorter. Add to this the fact that from space northeastern shrublands look more or less just like forests – it’s hard to gauge the height of vegetation based on the satellite images usually used to train land cover models – and it makes sense that shrublands are usually one of, if not the worst-represented class in land cover models.
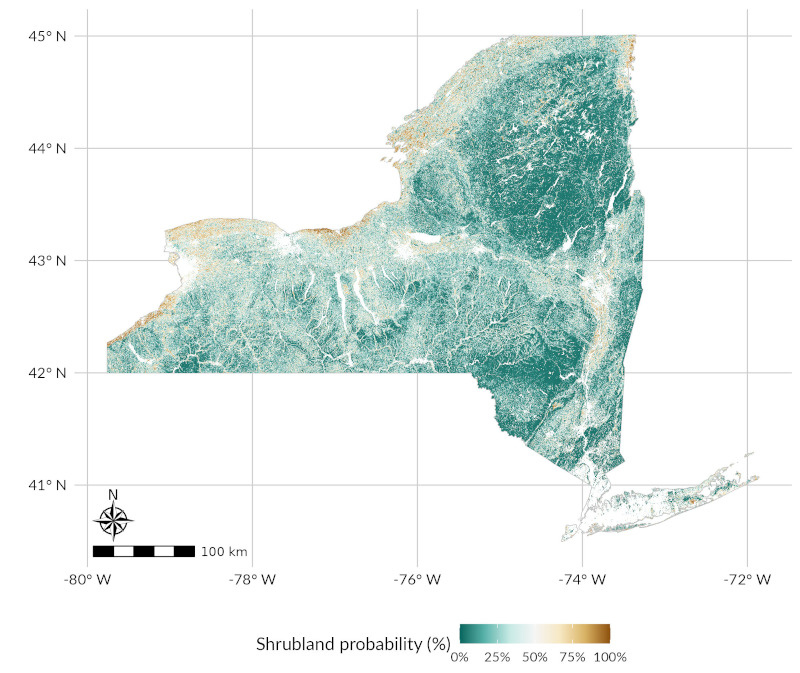
So, we set out to try and improve our ability to identify shrublands across New York State. We took the same basic approach as our AGB mapping project, used LiDAR data and national land cover maps to identify areas that were probably4 shrublands, and trained models against satellite imagery to try and ID shrublands in areas and years where we don’t have LiDAR data to work with. I think it’s a pretty cool project, and I’m excited to see where Abigail takes this line of work in years to come – as I understand it, she’s currently using the map to help her pick field sites, to try and investigate the dynamics of invasive species in shrublands across the state.
I’m also incredibly proud of the tech stack backing this project, which does not make it into the paper but really enabled this project from start to finish. In summer 2021, my lab invested heavily in standing up data-sharing infrastructure to make it easy to access pretty much any data that anyone in the lab had ever cared about, be it relatively raw remote sensing data, heavily-engineered predictor suites, or the outputs from past models.5 The original gains from this data platform were pretty incremental; we were already pretty deep in the weeds on our AGB work, so while it was nice that Lucas and I could easily send each other new data6, it just didn’t come up that often.
This shrubland project was then the first time we had a new, greenfield project that could take advantage of the data platform. And thanks to our internal infrastructure7 obviating out a lot of the rote busywork involved with collecting, processing, and generally marshaling spatial data from disparate sources, we were able to stand up the first proof-of-concept models much faster than with our past AGB modeling work.
This project wound up being quite the hairy beast by the time it actually went to print – the total archive contains ~640GB of data, uncompressed, plus a mix of R, Python, and shell scripts to actually process it all. I learned a lot from pulling this all together, and I’m very excited to see it out in print!
Footnotes
Including obviously the Great Depression, but also a great number of other panics such as the Panic of 1857. An interesting thing about living in the East is that practically all land in the region was, at one point or another, in private ownership; almost all state or federal lands were either purchased back from private owners or, more often, reclaimed when the owner defaulted on their taxes. A fun activity, for a certain value of fun, is looking up the date your local park was established, and then looking up the closest bank panic to guess if the two are related.↩︎
This is one of those things that feels like it should be made up, but if you think about it makes sense: trees more-or-less attempt to maximize sunlight intake, and can only get more sun by being taller than their neighbors, and, crucially, by not being shorter and therefore shaded out by competitors. As such, less competitive individuals from ruderal species will grow out more slowly than their neighbors, but either grow up with the rest of the neighborhood or get killed off altogether.↩︎
Which is not old for a forest by any extent, but is certainly older than most shrublands.↩︎
But not definitely, and we talk about this as a limitation! Maybe LCMAP thinks 5-foot tall wood post fences look like shrublands; if so, we’d be labeling our training data incorrectly. But our validation against 2019 imagery more or less agreed with our validation against the LiDAR-labeled map, which suggests this wasn’t that big of a problem in the end.↩︎
This infrastructure is one of my favorite projects I’ve been a part of in my PhD; I need to write about it publicly at some point.↩︎
Or, if I’m being honest, that Lucas could send me; if memory serves, while I wrote a lot of the code for how people could get data from the platform, it took over a year for me to learn how to send data to the platform for others.↩︎
The data platform and other internal model tools, though the data platform is much better than our internal model tooling. Part of that is because we don’t feel the need to keep a lot of our model tooling internal; we can open-source tools for dealing with common modeling problems much more easily than tools for dealing with our particular approach to cloud data storage. Speaking of which, go star waywiser on GitHub.↩︎