Late last year, the United States Department of Agriculture’s Forest Inventory and Analysis Program (FIA) quietly announced that they were changing how they calculated vegetation structural parameters – specifically the volume, biomass, and carbon content of trees across the USA – to use a brand-new set of allometric models. These models are a great step forward. They do a much better job of accounting for the non-merchantable parts of a tree and provide a nationally consistent method for how we calculate these values, replacing the old system which had sharp deviations across regional (not ecological) boundaries.
But fundamentally, this change means that going forward FIA is providing a different set of estimates relative to what they have provided for years. Anyone who’s building models from FIA data is going to need to update their workflows to adapt. In a new preprint out today, we – a team led by Lucas Johnson and with Grant Domke and Colin Beier – start exploring what that might mean for model-based carbon estimates and maps.
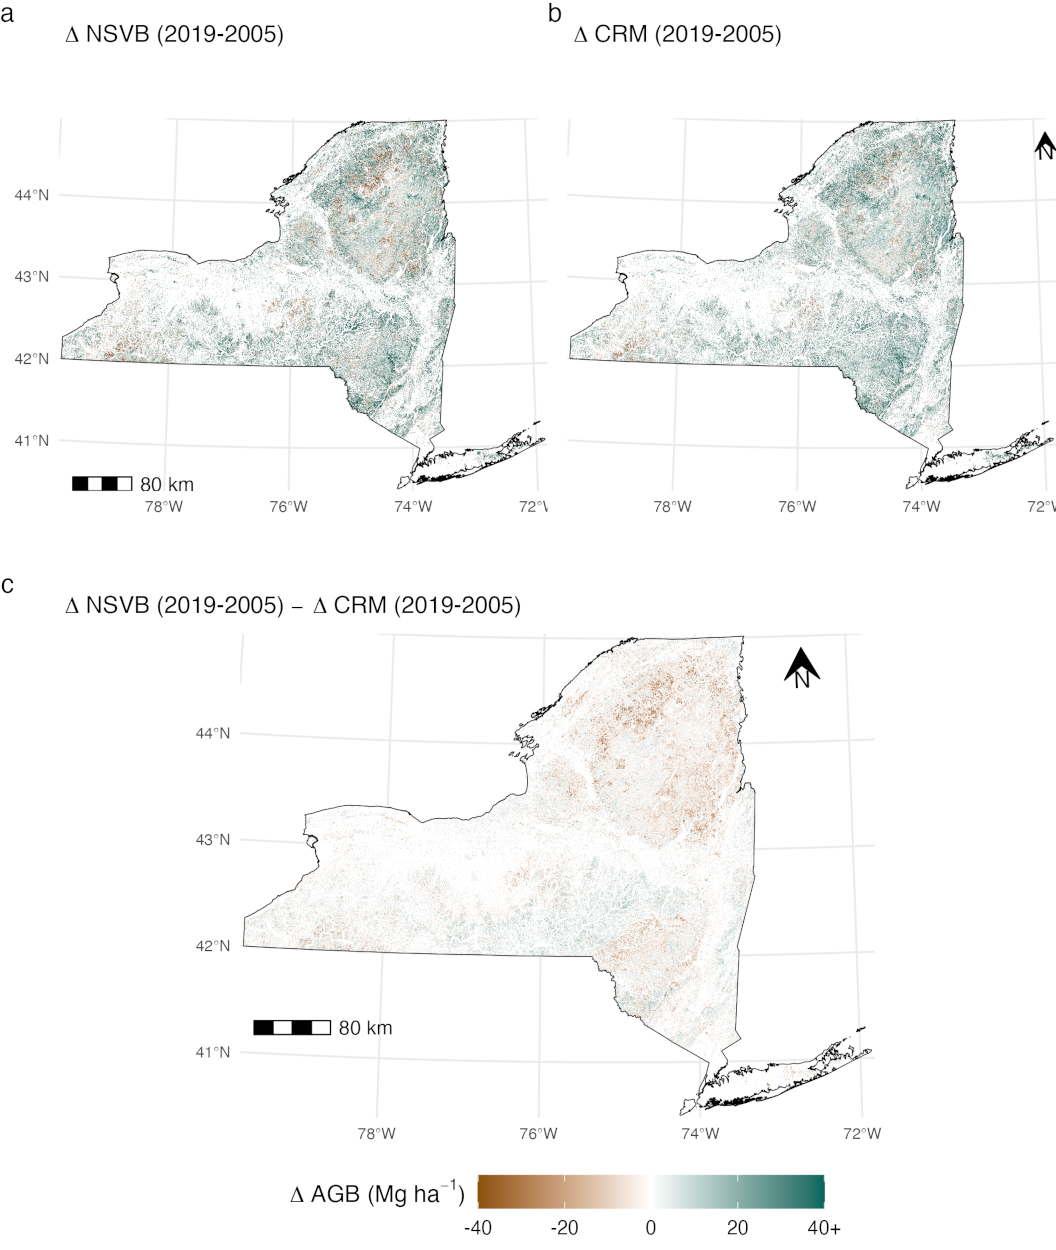
What we find is that, generally, the shift to these new allometrics is complicated! The new values aren’t pure rescalings of old estimates – while you can get close by using a linear model to update old estimates to the new allometrics, it’s not a perfect match, and some of the remaining variation is likely due to environmental factors and species composition across the landscape. And while model-based estimation approaches are still effective at expanding from field measurements to point-in-time carbon estimates across the landscape, we find that the new allometrics attribute a lot of forest growth to forests with full crowns, where passive remote sensing based models tend to saturate. That means that these models, even though they’re good at making point-in-time estimates, are worse at tracking growth over time in mature forested landscapes.
There’s plenty of more information about these challenges, alongside other explorations of what the new allometrics will mean for model-based estimation workflows, in the preprint.
This was a really fun paper to write – and as is tradition, we originally thought it would be a “quick hit” sort of project when we started on it back in Novemeber, when the new allometrics were released. It’s also (I think!) my first time actually “co-writing” a paper, where I wrote the Introduction and Methods section and then handed that shell to Lucas so he could actually do the real work involved. I enjoyed that process and think it produced a good result here; I’m really happy to see this preprint go out!