library(waywiser)
# Data on morality crimes in France:
data(guerry, package = "sfdep")
ww_global_moran(guerry, crime_pers, predict(lm(crime_pers ~ literacy, guerry)))Warning: multiple methods tables found for 'area'
I’ve got a new package on CRAN! waywiser is a yardstick extension package, providing functions for calculating spatial autocorrelation in model residuals in a way that cooperates with most (but not all, see below) of the tidymodels framework.
You can install it from CRAN:
install.packages("waywiser")Or the development version from the package’s GitHub page:
# install.packages("remotes")
remotes::install_github("mikemahoney218/waywiser")
You can use the package to estimate the spatial autocorrelation in residuals from any model – just provide spatial data, a vector of your “true” measurements, and a vector of your predicted values:
library(waywiser)

# Data on morality crimes in France:
data(guerry, package = "sfdep")

ww_global_moran(guerry, crime_pers, predict(lm(crime_pers ~ literacy, guerry)))
Warning: multiple methods tables found for 'area'Under the hood, waywiser uses two functions (ww_build_neighbors() and ww_build_weights()) to build sensible, if likely non-ideal neighbor lists and spatial weights for your data. However, waywiser also lets you provide your own weights object to override the automatic calculations, or provide a function to calculate spatial weights based on the input data frame:
weights <- ww_build_weights(guerry)

ww_global_moran(
  guerry,
  crime_pers,
  predict(lm(crime_pers ~ literacy, guerry)),
  wt = weights
)
Providing our own weights is necessary in order to use the _vec() versions of waywiser functions, which can be helpful for use in dplyr functions:
# For the %>% pipe and mutate:
library(dplyr)
# For visualization:
library(ggplot2)

guerry %>%
  mutate(pred = predict(lm(crime_pers ~ literacy, .)),
         .estimate = ww_local_moran_i_vec(crime_pers, pred, weights)) %>%
  sf::st_as_sf() %>%
  ggplot(aes(fill = .estimate)) +
  geom_sf() +
  scale_fill_gradient2(
    "Moran's I",
    low = "#018571",
    mid = "white",
    high = "#A6611A"
  ) +
  theme_minimal()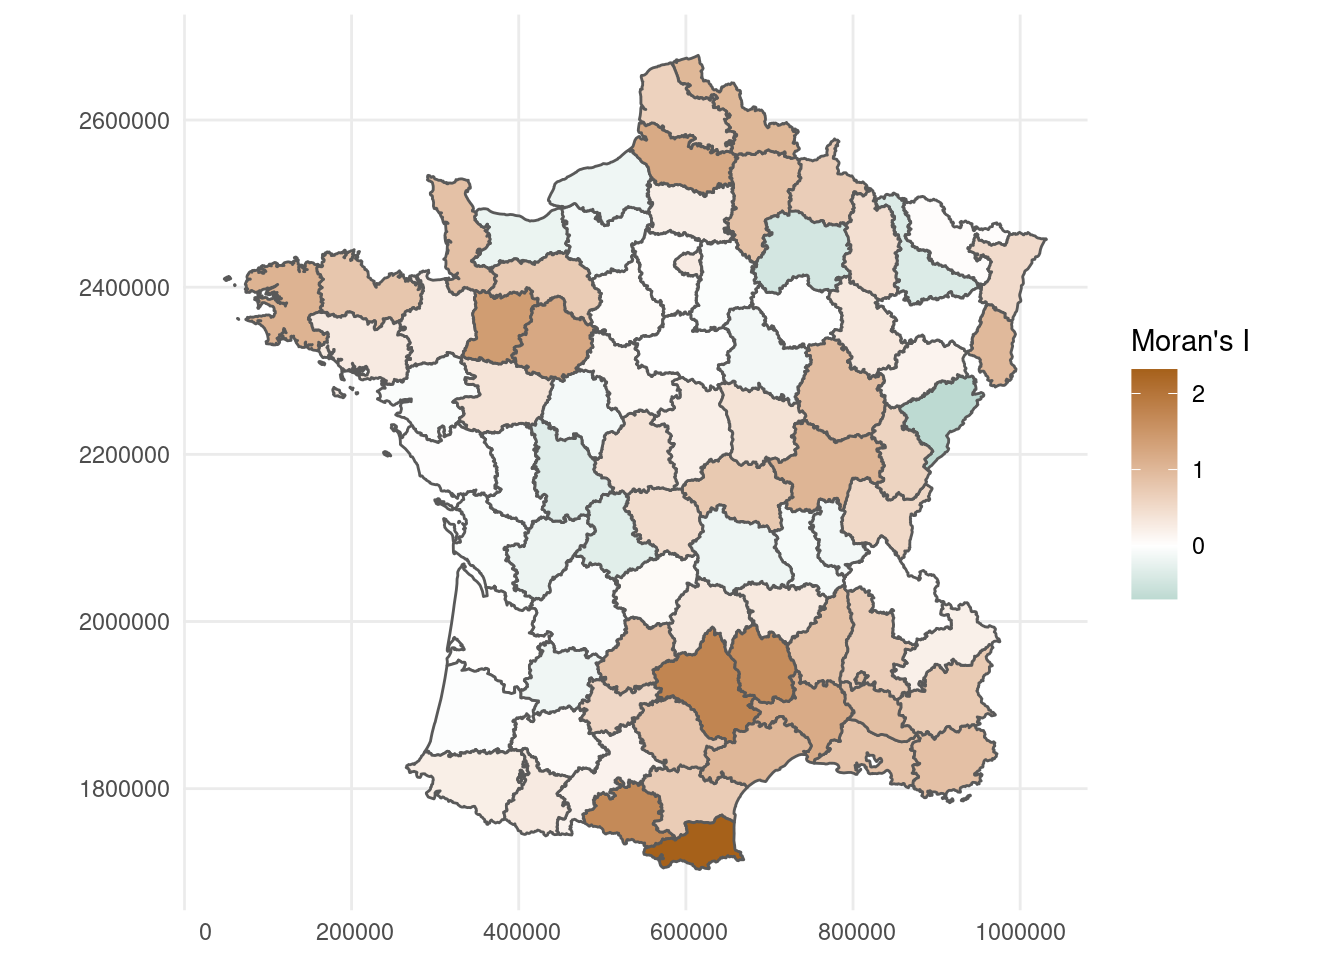
The package currently provides three main indices of autocorrelation – namely, Moran’s I and Geary’s C (both in global and local variants), as well as Getis-Ord’s G and G* (only the local variant).
This first version of the package integrates well with the rest of the tidymodels framework, except for the tune package (due to some difficulty in exposing either the original spatial data or the weights object to waywiser function while tuning a model). As a result, this version doesn’t let you include these functions as metrics to calculate inside of a call to fit_resamples().
The full list of features and documentation can be found on the package’s website. This has been a really fun package to work on; I’m excited to see it out in public, and will look forward to seeing if anyone else finds it useful!